Chart: META vs S&P 500
Chart: META vs S&P 500
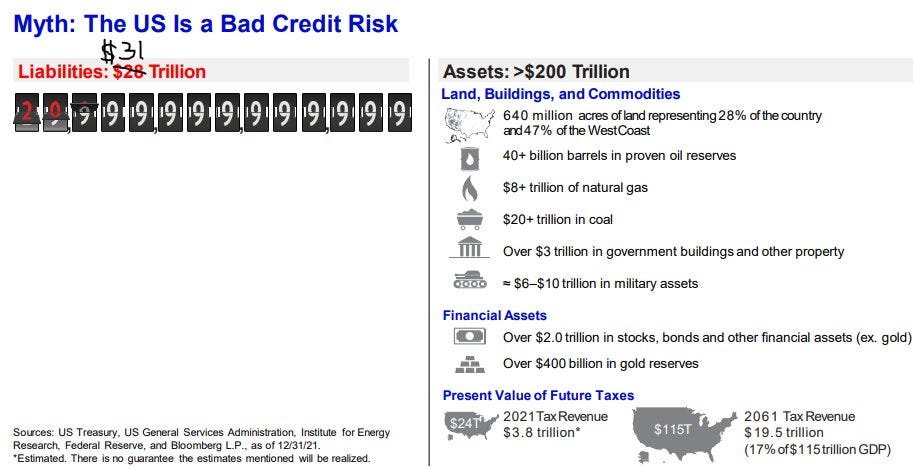
US Debt to GDP to Assets
A couple “wild but true” charts today:
1: META 0.00%↑ (AKA Facebook) is trading at a level not seen since 2015. If you bought META during its 2012 IPO, as of today you would have underperformed the S&P 500 (total returns).
In fact, the cumulative S&P 500 return would be 120% higher!
What a spectacular turn of events since META’s September 2021 peak. It’s not alone, of course. Many other big tech stocks are down massively from their peak. I wonder if investors will develop a longer-term aversion to tech names after this bear market is over.

2: People often point to the US debt-to-GDP ratio of 121% as a sign the economy is in trouble. But this ratio doesn’t paint a complete picture.

First of all, nobody knows what debt-to-GDP ratio is “too high" - especially when it comes to the country with the most powerful army, biggest economy and strongest reserve currency.
Moreover, they also usually fail to consider the other side of the balance sheet: assets.
When you consider the health of your personal finances do you only look at the size of your debts? No. $100k in debt for someone with no assets and an $80k salary is a bigger drag than it is for someone with $1m in the bank and an $80k income.
According to the chart below, the US has assets of over $200 trillion, leaving its equity position a whopping $169 trillion (give or take, depending on whether you adjust debt for unfunded liabilities). Context is important.