Rapid Fire: 5 Charts
Rapid Fire: 5 Charts
Quick hits for a Monday morning
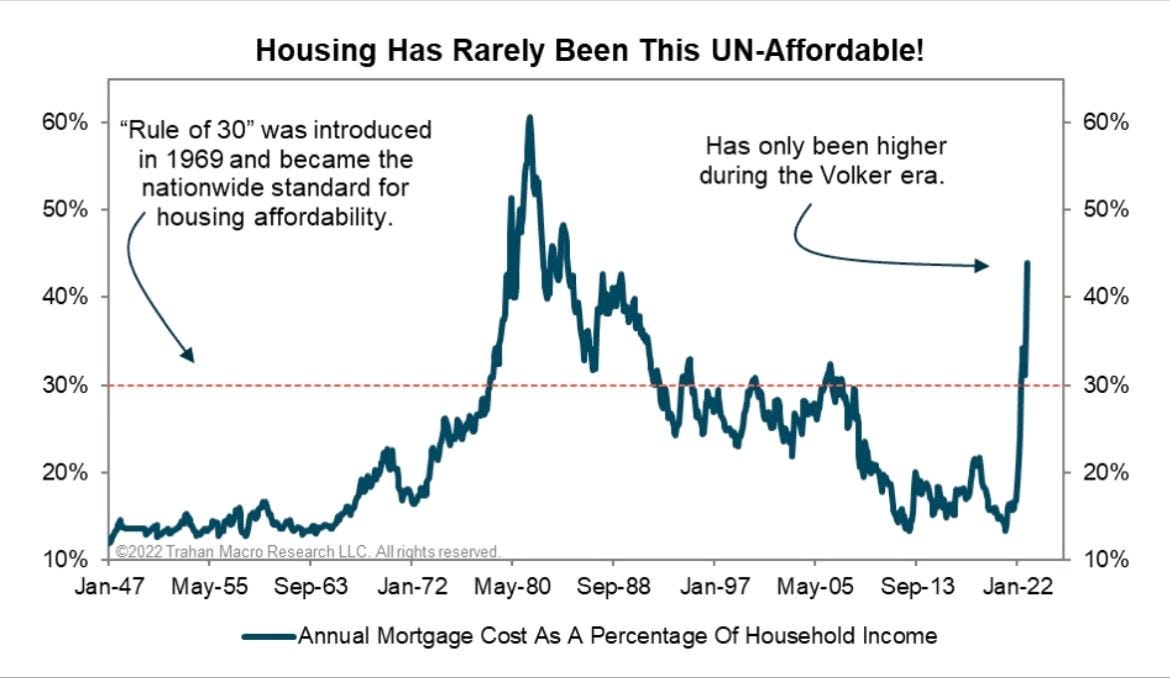
1: As a percent of household income, housing hasn’t been this unaffordable in about 40 years.
Of course, 40 years ago was a great time to buy a house, invest in stocks and own bonds. 40 years ago also marked the climax of the stagflationary 1970s, the apex of Volcker’s restrictive monetary policy and the start of secular disinflation, which provided the multi-decade tailwind for risk assets. I’m not saying we’re there yet, but it makes you wonder what today’s chaos might bring once it settles.
2: What does “unaffordable” actually mean? The cost to buy a home in America today is more than triple the cost just several months ago.

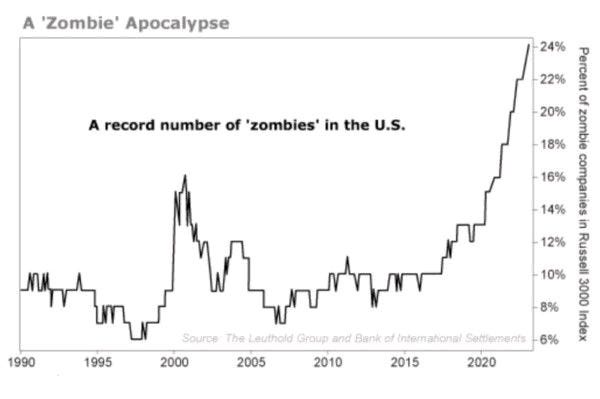
3: The zombies are running wild! Approximately 24% of Russell 3000 companies in the US don’t earn enough operating income to cover interest on debt. These are companies that rely on the kindness of strangers - i.e. dependent on capital markets or bailouts - to stay alive.
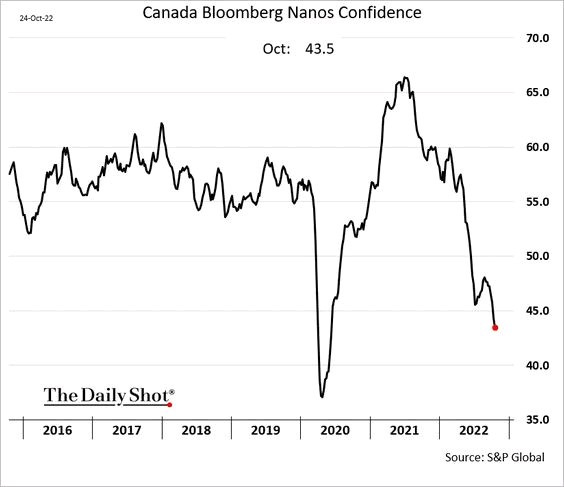
4: Consumer confidence in Canada is plummeting. Rising mortgage rates, declining markets and fear of recession are pushing people to the edge.
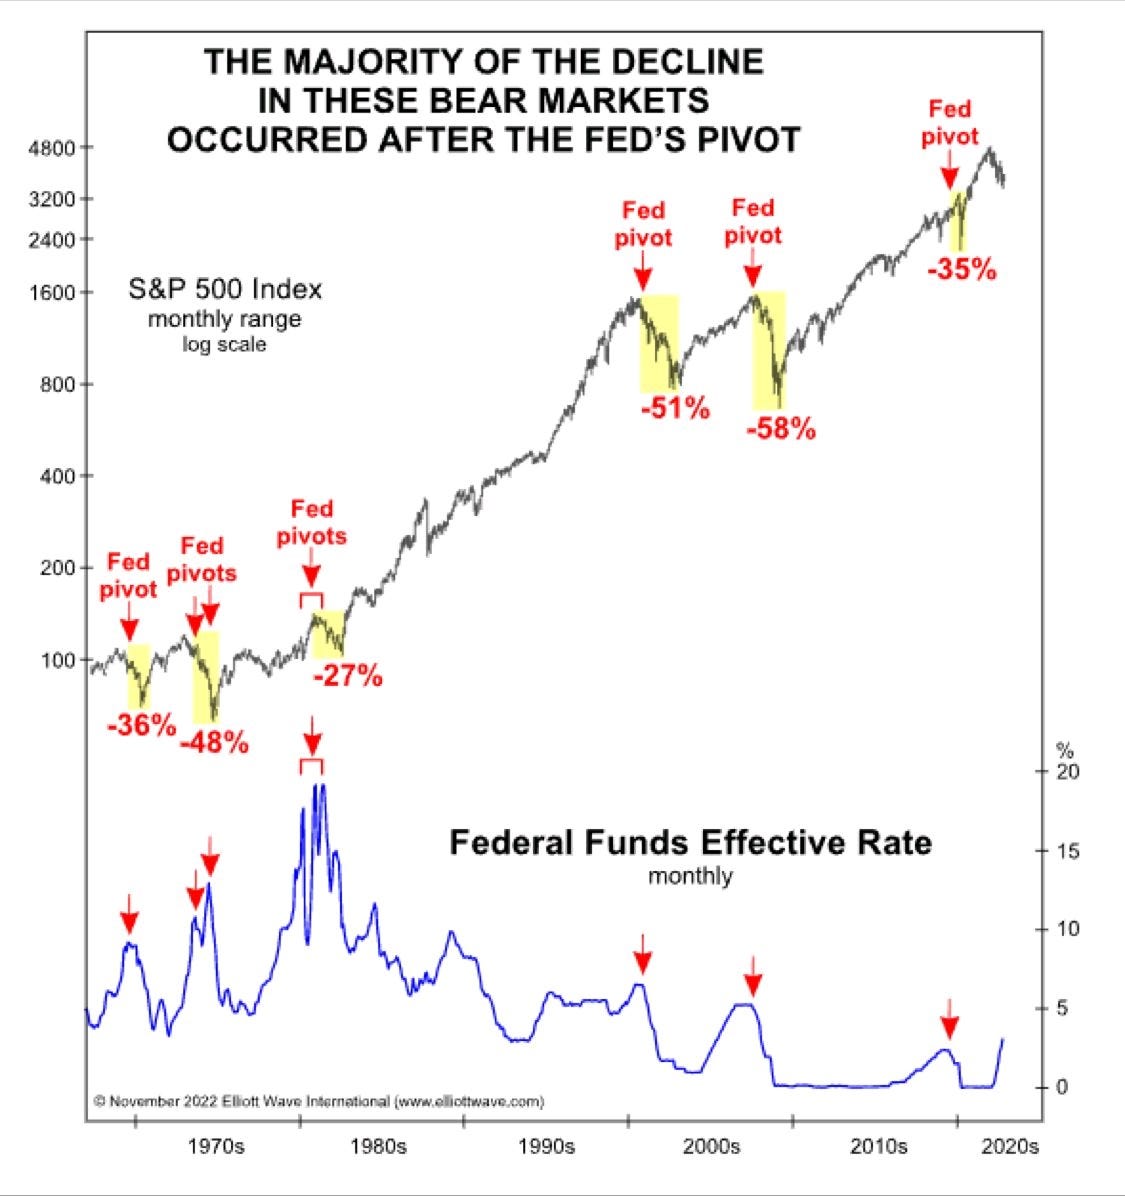
5: I mentioned in a previous post that a Fed pivot won’t necessarily rescue markets. Indeed, often the pivot is the Fed’s delayed reaction to rapidly deteriorating financial conditions. The chart below illustrates this nicely.